Sign up for our newsletter

Newswire – April 24, 2018

UNIONS STAGE WALKOUTS. In case you hadn’t heard, the national teachers’ unions are staging/pushing for teacher walk outs across the country. In case theyhadn’t heard, the nation’s report card says less than 50 percent of our kids are proficient in the basics – with the percentages being dramatically less if you’re a minority or at-risk student. The exception to this persistent years-long rule can be found in the states that have seen dramatically more opportunities offered to kids…

LIKE ARIZONA — where charter students boast larger NAEP gains than any state. Ironically, despite this success, teachers are being pressured to walk out, even among the leading charter schools. This was anything but organic – In fact, West Virginia labor leaders claim to have inspired Arizona’s walk out this week.

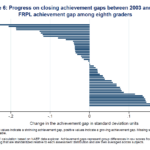
BUT IN COLORADO…  Scores have remained stagnant and the achievement gap unacceptably wide. In fact, Colorado is near the bottom of states in making progress in closing that gap. Despite that, teachers across Colorado are also planning walkouts. Their gripe is funding. It should be achievement.

A friend in Colorado shared a letter from the Douglas County School District, excerpted below.

“…teachers across Colorado are attending rallies at the State Capitol later this week to call for increased education funding. Many districts decided late last week to close school on either Thursday, April 26 or Friday, April 27. We have been monitoring time-off requests carefully over the last few days. Yesterday, requests increased significantly, such that there are not enough substitutes in the system to cover all classrooms across our district.

“As a result, our neighborhood, magnet and alternative schools will be closed on Thursday, April 26. District charter schools, that manage their own staffing, will remain open and operating on a normal schedule. [Editors note:  we would like to repeat that last sentence. “District charter schools, that manage their own staffing, will remain open and operating on a normal schedule.”] …we recognize that this presents challenges for many of our families. However, with over 500 of our educators out, we will simply not be able to provide a safe and effective learning environment for all of our students.

“WANT TO KNOW WHEY THEY ARE STRIKING?” According to the Denver Post It’s about pay and benefits and spending of course.  (The Post doesn’t mention the four-day school week that more than half of schools now have in CO, by the way.) Nor is there coverage anywhere about the “School-Staffing Surge,” the phenomenon that has dominated US public schools for more than 50 years. It goes like this: “Public schools grew staffing at a rate four times faster than the increase in students over that time period. Of those personnel, teachers’ numbers increased 252 percent while administrators and other staff experienced growth of 702 percent, more than seven times the increase in students.” And the number of teachers since prior to NCLB have grown more than twice that of students!

BUT THERE’S MORE TO IT THAN EVEN THAT.  We agree that “There’s an important conversation to be had about teacher pay, benefit costs, and how to attract and honor terrific teachers — and pay fairly professionals who put in a solid day’s work,” as one of the nation’s leading education policy experts Frederick Hess of the American Enterprise Institute posits. “And, like many, we think the gains that Oklahoma’s teachers have now won are reasonable and appropriate.

But it appears that, even more than in the case of West Virginia — where teachers returned to work with a comparatively Spartan 5 percent pay bump — Oklahoma’s walkout is quickly becoming detached from efforts to ensure that dollars are spent responsibly. When teachers who have already claimed a massive win are shuttering schools over demands for retiree cost-of-living-adjustments and the need to “staff-up” other state agencies, it seems farfetched to say that student concerns are still front and center.”

Let’s be clear: The unions want to make teacher pay a defining issue. But it’s not, or at least it shouldn’t be. The defining issue is educational excellence. Pay should not simply be an award for time spent at a job. But few teachers are paid for their success or for being great educators. They’re paid for their longevity, based on fixed pay scales designed to achieve “fairness” instead of reward excellence. It’s a system that’s been legislated and lobbied for by the unions (and which has helped massively in sustaining the unions) who are now urging protests – not to improve education, or reward excellence – but to, simply, increase teacher pay.

FINALLY, IN PUERTO RICO TOMORROW…  teachers will walk out to protest not pay but the introduction of choices for kids trapped in failing schools. These walkouts are hardly spontaneous uprisings by local teachers. Indeed, AFT President Randi Weingarten was overheard “…plotting a teachers’ strike to shut down schools in Puerto Rico…” Yes, you heard it right, as did all her fellow Amtrak passengers who were able to hear her surprisingly unguarded cellphone conversation with an unknown co-conspirator. The gist of the story is that Weingarten was calling for teachers to use personal and sick days, not for their intended purposes, but to stage a strike, which she cautioned should not be called a “strike” but, rather, union members serving as “human shields for kids.” Read about it here.

ONE MORE THING.  These latest union-led shenanigans are, in part, what the Janus case that’s before the U.S. Supreme Court (and Friedrichs before that) is all about. If you’re a teacher and you don’t agree with what the union is doing, and how it’s using the money it takes from you in dues: tough!  You have to pay up anyway. A ruling in favor of Janus would change that miscarriage of fairness and justice.

Newswire – April 18, 2018

LIVE FROM SAN DIEGO… IT’S THE ASU+GSV SUMMIT!

TRANSFORMATION. It’s the thread that ties together all engaged in this, the 9th annual summit. University innovators, coding zealots, edtech investors, developers, advocates and educators have spent the past two days pitching, conversing and launching what may become the latest innovation for students. What makes this confab great is the openness of everyone here in rethinking everything, including how to do what we do know even better.

“We know what works in education,” said Timothy Renick, a Senior Vice President at Georgia State University and the winner of the Harold W. McGraw Jr. Prize in Higher Education. “They need individualized education,” but universities are not set up to deliver more personalized learning, he said. “Why not?”

WHY NOT? That’s the attitude that Phyllis Lockett had one summit that made her stay an extra day and develop the business plan that became LEAP Innovations, a Chicago-based, edtech nonprofit that works with schools to develop personalized learning approaches supported by new innovations and edtech tools. Phyllis won the summit’s “Innovator of Color” award this year.

Phyllis Lockett


ASU INNOVATIONS. Each year attendees are regaled by ASU leadership who offer compelling visions of how to deliver higher ed here and abroad in more effective and efficient ways. The thought-provoking ASU president Michael Crow, who helped launch the summit, offered his view that the students of today no longer are wired to sit and listen but to engage. As Summit attendee and founder of VIDASHARKS, Eric Chagala, put it, Crow’s message is critical “as a new generation of leaders in education and policy stand to rise against the rigidity of a system that still sorts winners and losers.”


“History is determined by the people who stand up at a particular place and time.” —Michael Crow

NEW COLLEGE? Chegg Founder Dan Rosenswig is among the many here who believe we have to turn college on its head if we want to ensure completion with a purpose. “If you can binge watch [Netflix], you can binge watch college,” he told his audience. As Wyatt Cash reported, It’s time to abandon the two and four-year college model.

HELPING RURAL EDUCATION was also a theme, sparked in part by CER’s leadership on this issue before and during the summit. (Check out our session video here.) If bandwidth is the issue, companies like Nucleos.com can actually bring the internet to schools via a portable cloud! Looking for content? Try the hundreds gathered who are using data to demonstrate student learning, likeCarnegie LearningWaterford and Nearpod, to name just three.

ARE HIGHER ED ACCESS AND WORKFORCE your jam? You should look up Burning GlassEllucianNoodle and Strada, each of which are leading and providing tools and resources to help us all rethink the path from the early years to productive engagement in life.


TAKING ED INNOVATION INTO EDREFORM. We met new friends, strengthened old alliances and connected with education dignitaries and leaders like President George W. Bush and Angela Duckworth, who our CEO had the pleasure of introducing before her keynote address on Tuesday morning.

As CER approaches its 25th anniversary, we’re moving our focus from reform to innovation, and working to ignite the efforts of all the innovators here to ensure that the next 25 years of education efforts produce dramatically more results than the first. We will convene and coordinate actors across the thousands of efforts present to ensure that the best of all make their way into the nation’s schools, homes and learning environments of every level, shape, size and scope.

JOIN US THIS YEAR in doing just that! Stay informed with updates here.

CER at 25: Driving Education Innovation and Opportunity

Newswire – April 11, 2018

THIS WEEK, you can’t scan your favorite news site, Twitter feed or newspaper (yes, they’re still out there) without reading about the Nation’s Report Card. Scores from the National Assessment of Educational Progress (NAEP) for 4th and 8th grade reading and mathematics are out. So are the opinions.

But look again: no one’s talking about the timing of the release of these startlingly bleak, stagnant scores just days before the 35th anniversary of the landmark 1983 report, A Nation at Risk: The Imperative for Educational Reform. The connection between these two reports is obvious and our observations are clear: where innovation and opportunity are encouraged, the results are better — in some states, significantly better. Florida’s unprecedented gains in both reading and mathematics were the highest.

Demanding Progress


A NEW FEATURE ON OUR WEBSITE
is devoted to the NAEP scores, the analysis behind the data and trends, current commentary and decades of CER resources and research representing our unparalleled efforts on the frontlines challenging the status quo and working against the rising tide of mediocrity that was decried as eroding the educational foundations of our society in A Nation at Risk 35 years ago. The feature is called, “A Nation Still at Risk? Results From the Latest NAEP Recall the Report From 35 Years Ago.” There you’ll find the scores from this year and previous years, the entire A Nation at Riskreport, the story behind Florida’s success and much more. Check it out.

The Case for Education Transformation


THE CASE FOR EDUCATION TRANSFORMATION
, Part I: The Disappointing Reality of American Education was published in February. It’s now been updated and reissued with the newest data from the 2018 NAEP report. New findings and further analysis shed even greater light on widening achievement gaps and proficiency stagnation:

“Data from the most recent National Assessment of Educational Progress show that the lowest performing students in the nation are faring worse than they did on the same assessment in 2015. The gap in reading achievement between the nation’s poorest and wealthiest students equates to more than six years of learning in middle and high school.”

Reality Check With Jeanne Allen


A SPECIAL REALITY CHECK WITH JEANNE ALLEN PODCAST
offers a deeply personal commentary by CER’s founder and CEO, who looks at this week’s NAEP scores through the lens of more than 30 years of driving the most innovative efforts to transform how we educate our citizens. Don’t miss this special editionof Reality Check as Jeanne shares her insights and analysis of the trends and challenges we face if the nation does not transform how — and what — we do to educate learners at all levels.

American Education: 35 Years of Mediocrity Since A Nation at Risk


IN ONE OF THOSE TELLING IRONIES
that pop up every now and then, this week’s release of NAEP scores just happens to coincide with the 35th anniversary of the release of the landmark report on education: A Nation at Risk.For many Americans, the report was unsettling. It was a principle of citizenship to believe that America was the best in everything, especially in education. So it all came as a shock when the report said there was “a rising tide of mediocrity” in our schools; that educational content “was a mile wide and an inch deep”; and that our teachers were lacking the necessary qualifications to ensure expert teaching, particularly in math and science. And it didn’t calm any concerns when President Reagan stepped up to lead the call to action, telling his fellow Americans that our education system was plagued by “low standards, lack of purpose, ineffective use of resources, and a failure to challenge students to push performance to the boundaries of individual ability.” So the fact that the latest NAEP scores show that 35 years later, we are still a nation at risk is a sad, frustrating irony. The first Reagan Institute Summit on Education convenes tomorrow to commemorate the work of the report’s creators — the National Commission on Excellence in Education. Dozens of current and former elected officials from all levels of government will discuss a new path forward. Will they be bold and unyielding in their demand for change? Here’s hoping so, along with a reminder that the subtitle of the Nation at Risk report was, “The Imperative for Educational Reform.” Read more in National Review Online.

STAGNANT NAEP RESULTS POINT TO A NATION STILL AT RISK

Recalling Reagan’s words: “When they graduate high school, they are prepared neither for work nor higher education.”

(Washington, DC) — Precisely 35 years after A Nation at Risk was released this month in 1983, student achievement is either flat or dropping for many US students, according to the results of the latest National Assessment of Education Progress, known as the Nation’s Report Card. Scores from the 2017 NAEP administration saw no significant change from the prior 2015 assessment, save for a one-point increase in 8th grade math scores. The scores should startle Americans:

• READING PROFICIENCY or ABOVE: 4th grade – 37 percent; 8th grade – 36 percent;

• MATH PROFICIENCY or ABOVE: 4th grade – 40 percent; 8th grade – 34 percent;

• Math proficiency declined in 10 states.

Officials report that at the basic level, students have made considerable progress since the 1990s, from 50 percent to 80 percent in 4th grade math, for example. However, basic levels are not acceptable levels for competency in work or life.

“This month 35 years ago, extraordinary findings and bold recommendations for action catalyzed a nation. These scores are a sobering reminder that we remain a nation with far too many children and young adults poorly educated, unprepared to enter college or the workforce, and ultimately, unable to achieve the American Dream of living a rewarding, prosperous life,” said Jeanne Allen, Founder & CEO of the Center for Education Reform.

“The NAEP scores show that the need for a fundamental transformation of American education has never been greater, or more urgent.”

In 1983, within days of the Nation at Risk report release, President Ronald Reagan told the nation, “Our education system, once the finest in the world, is in a sorry state of disrepair…13% of our 17-year olds are functionally illiterate, and among minority students it’s close to 40%. More than 2/3 of high school students can’t write an essay.”

“This ‘sorry’ state still largely exists today,” added Allen.

CER Research Fellow Dr. Cara Candal who has studied NAEP trends noted that even when math scores rise in middle school they later stagnate or fall in high school, a critical point in learners’ lives as they seek college admissions and to become productive adults preparing to enter the workforce. “Not only are these flat 4th and 8th grade reading and math scores case for alarm but between 2005 and 2015, 12th grade math and reading scores were also stagnant or showed decline—with very slight upticks in some years and subsequent downward trends.”

The only bright spot in the data released by the National Assessment of Educational Progress today is Florida and Puerto Rico. Florida, in particular, saw unprecedented gains statewide and in two of its largest districts, Miami and Duval counties.

“When innovation and opportunity are kindled, educational success follows,” said Allen. “A Nation at Risk called on us to expand both—it’s high time we responded.”

###

Important Implications of the NAEP Results

The most recent NAEP results reveal two important things:

1) The bar that most states set for students is painfully low. 88% percent of students in this country graduate high school, but NAEP shows that far less than half of 12th graders read and write at or above proficient rates. In fact, NAEP’s assessment are better aligned with international assessments like TIMSS and PISA than most state tests. It’s no wonder Americans turn in a middling performance on these exams in comparison to their peers in other countries.

2) It’s time to be bold and understand the opportunity-based reforms that are helping subsets of students achieve a higher bar. Despite overall disappointment, NAEP reveals pockets of success in some places—places where even the most disadvantaged students are making it to and through college, or taking advantage of innovative and rewarding post-secondary opportunities that afford them entrance to the middle class. (For more, see Education Transformation, Part 1.)

About the Nation’s Report Card National Assessment of Educational Progress (NAEP)—Fast Facts:

What Is It?

NAEP is the largest nationally representative and continuing assessment of what America’s students know and can do in various subject areas.*

When Is It?

NAEP tests different subject areas every year. The first NAEP test was administered in 1969.

How Is It Different?

NAEP assesses the high-level skills and competencies that students have at critical points in their K-12 careers (4th, 8th, and 12th grades). It is not aligned to specific grade-level competencies or standards.

What Can NAEP Tell Us?

NAEP results can tell us about improvements or declines over time in what students know and can do in different content areas. NAEP can also tell us how different sub-groups of fare, how different states compare to one another, and about the progress of large urban districts.

Why Is NAEP Important?

NAEP is known as The Nation’s Report Card because it is the only common measure of what students across the country know and can do. NAEP is more rigorous than state tests and it is “technically sound,” which means it is an extremely reliable assessment.

What Does NAEP Tell Me About The Schools In My State?

NAEP acts as a reality check for states that claim high numbers of proficient students in core subject areas like reading and math. When states claim high proficiency rates but NAEP proficiencies are low, the low standards that most states set become clear.

(For more, visit the NCES website.)


Back to A Nation Still At Risk? Results From The Latest NAEP Recall The Report From 35 Years Ago

Correlation Between NAEP & College Readiness

Lower NAEP scores correlate to lower college completion. NAEP indicates that when the average student graduates high school today, he or she is no more or less proficient in core subjects than his or her parents were in the 1980s. Research shows that proficiency on NAEP’s reading test is a leading indicator of college readiness. We can’t say that for most of the tests student takes today, which is one reason why the majority of students who enter college in this country don’t graduate.

New research by the Center for American Progress finds that in 46 states, high school graduation does not meet the need requirements of public universities. According to Laura Jimenez, the author interviewed for the 74:

“The cost of remediation is high. It’s costing students upwards of…around $2 billion a year in out-of-pocket costs. So it’s a problem. And the root of it is that there really isn’t official coordination between K-12 and higher ed around what it means to be college- and career-ready.”

Here’s a refresher and commentary from the last few NAEP releases:

Results from the 2009 Nation’s Report Card Math Results for 4th and 8th Grade

CER: About the 2013 Release

And how few 12th grade students achieve


Back to A Nation Still At Risk? Results From The Latest NAEP Recall The Report From 35 Years Ago

About the 2017 NAEP Results

In grade 4 reading, 37 percent of students scored at or above proficient. Eighth grade reading was the only subject-area/grade combination to show improvement. Thirty six percent of students scored at or above proficient, up two percentage points from 2015. There were no significant changes in grade 4 or grade 8 mathematics. Forty percent of 4th-graders and 34 percent of 8th-graders scored at or above proficient. These results aren’t very different from 2015 or 2011 except for 8th grade.

The same general trend holds true for race- and ethnicity-based achievement gaps: while scores for black and Hispanic 4th- and 8th-grade students have improved since the 1990s, far too few are proficient in math and reading.

As sobering as these data are, long term trends for high-schoolers are even more disappointing. 12th graders did not take the most recent NAEP, but they have remained relatively stagnant over time. Even worse, when 12th grade NAEP scores were last released in 2015, only 25% of students scored at or above proficient in math. That number was only slightly better in reading, with 37% of 12th graders scoring at or above proficient.

This begs the question: what is going on in U.S. high schools? Are they providing additional learning and skills, or are they erasing the painstakingly slow progress that elementary and middle schools are making?

With these disappointments come a few bright spots. NAEP can tell us how students in different geographies perform. Places like Massachusetts, Indiana, Washington, D.C., and Arizona have made impressive gains in recent years. Florida made historic gains in 2017. So did 6 out of the 27 urban districts for which NAEP provides disaggregated data. One of those districts is Miami.

Localities that have seen stagnant or declining scores (and there are many) can learn from these states and large districts. It is likely no coincidence that most of the places that have seen the greatest gains on NAEP are also the places that have done the most to empower parents with opportunity-based reforms like charter schools and vouchers.


Back to A Nation Still At Risk? Results From The Latest NAEP Recall The Report From 35 Years Ago

Kentucky Lawmakers Fail to Fund Charter Law

Kentucky Earns a D

News Alert

April 6, 2017

Dear Friends,

In 2017, as Kentucky lawmakers were patting themselves on the back for passing a charter school law, the National Charter School Law Scorecard gave the state a “D” for having one of the weakest of 44 charter laws in the country. Yesterday, the legislature made history for being the first to ever enact a charter law and fail to fund it. This fact alone will earn Kentucky a “F” in the next scorecard. Where there are no funds, there can be no schools.

Kentucky Earns a D

Two months ago, out of deep concern over the charter policies in Kentucky, our CEO, Jeanne Allen, wrote an op-ed for the Kentucky Courier-Journal. Allen reminded us that because of the way the charter law was written, charter schools would have to rely on a separate appropriation for funding; therefore, financing was going to be a problem, and Kentucky charters would forever be vulnerable to politics.

This week’s actions in Kentucky make it clear that lawmakers do not value educational opportunity for students who desperately need new college and career pathways. In states with robust charter school laws, millions of students thrive. We cannot expect our children to move forward and climb out of the depths of mediocrity (as we’ll likely see in next week’s NAEP scores) if we don’t fund the necessary mechanisms critical to student success.


Founded in 1993, the Center for Education Reform aims to expand educational opportunities that lead to improved economic outcomes for all Americans — particularly our youth — ensuring that conditions are ripe for innovation, freedom and flexibility throughout U.S. education.

Newswire – April 3, 2018

Pat Korten

CAUTION: This newswire contains serious and thought-provoking commentary on teacher pay and teacher strikes.

Strike
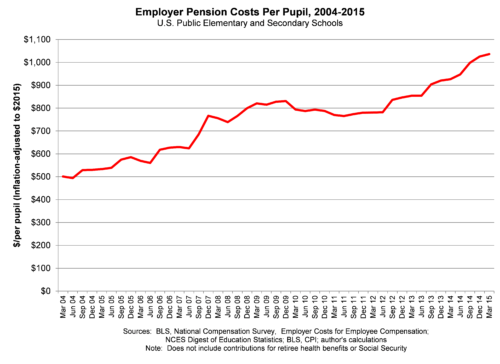
IN LIGHT OF THE TEACHER STRIKES, we are compelled to bring you some facts, research and data about teacher pay that we hope will enlighten and inform readers and help you avoid simply falling into the trap of saying to yourself, “Oh wow, this is awful that we pay teachers so poorly…” Indeed, we do pay teachers poorly, and the pay scales and structures of how teachers are hired, rewarded, retained and paid later in retirement are completely broken. This is not an exhaustive analysis, just a smattering of thoughts that should propel you to do your research before jumping to conclusions.

MOST ARE OUTRAGED BY TEACHER PAY LEVELS. How bad are they, really? The answer is, It depends. Confirms the California education blog ED100: “It is difficult to accurately compare teacher pay with private sector pay, because they work differently. In a simple comparison, teacher salaries can seem worse than they are. Private-sector workers’ retirement dollars flow through paycheck deductions and build up in a way that is easy to count. They show up on a monthly statement. They accumulate in an account… Teacher pensions, by contrast, don’t accumulate. Like a life insurance contract, teacher pensions are a promise of future payments. The ‘payout’ on this contract varies mostly on how long the beneficiary lives.” Incidentally, that payout results in teachers being able to retire and earn nearly their full salary for every year of their lives afterward.

Then there are union dues, which can be another $600-$1,000 a year, with no obvious benefit other than to be told why your profession is underpaid and encouraged to strike… This why tens of thousands of teachers oppose these compulsory paycheck fees, teachers like California’s Rebecca Friedrichs who took her case to the Supreme Court and Illinois’ Mark Janus who is awaiting the High Court’s decision on his challenge (which will likely be handed down this June). (For background reading, see this op-ed by CER’s CEO, Jeanne Allen, and listen to this podcast with Mark Mix, president of the organization that represents Mark Janus.)

STRIKING FOR THE WRONG THING? The teacher unions won’t tell them, but the teachers who are striking across the country aren’t going to solve anything even if the legislatures give them an annual raise. Why such a strident statement? Consider the following number: $1,000 PER PUPIL. That’s the annual cost of employee pensions. Imagine a school of 600 students — that’s $600,000! Let’s just say half those funds could go to teachers instead of the state pension coffers upfront. There are approximately 26 classroom teachers in a school that size, if we are talking a traditionally organized school. If you took just half of those funds and put them in teachers’ salaries in that school, they’d be earning another $11,000 a year each! Please note that these funds are above and beyond employee contributions, Social Security and taxes.

Employer Pension Costs Per Pupil

LET’S TALK MORE ABOUT PENSIONS. As teachers retire they will need to access the pensions they were promised and which the state has paid into. Those funds are paid by the current crop of teachers, to the tune of ten percent of their earnings. Let’s take the average pay for an Oklahoma teacher — $50,000 (which is equivalent to about $76,000 in Stamford, Connecticut. For all you New York Times readers, the cost of living in the Northeast is between 40-60% higher). According to a study from the National Center for Analysis of Longitudinal Data in Education Research, “On average across state plans, over ten percent of current teachers’ earnings are being set aside to pay for previously accrued pension liabilities. This amounts to a large reduction in real operating spending per student. . . . A significant fraction of the resources allocated toward teacher compensation in current public education budgets is not being invested in resources to educate today’s students at all.”

WHAT TO DO? Researchers who have been studying this issue for years argue that there are several policy changes that could favor teachers while they work and reduce the pension burden that accumulates on states that are constantly threatened by shifting economic conditions: “(1) transition teachers to defined-contribution retirement plans, (2) transition teachers to cash-balance retirement plans, and (3) tighten the link between funding and benefit formulas within the current defined benefit structure.”

IF YOU REALLY WANT TO GET SMART on teacher pensions, you need to spend some time here. The solutions guiding what teachers make and what the state spends, on top of pension costs. There have been dramatic increases in the past ten years in public pension and benefit spending.

TIME TO RETHINK TEACHER PAY. We’re rethinking everything else — higher ed, K-12, workforce, school safety — so how about teaching? First, compensation is wildly uneven, being delivered to teachers through schools based on state rules governing experience and pay schedules that often see teachers meeting the peak of their salary years after most other professions, in their 50s! As respected researcher Marguerite Roza writes for the left-leaning Brookings Institution“…a disproportionate amount of available salary funds is concentrated on teachers at the end of their career.”

“District leaders are steering a disproportionate share of the highly constrained public education funds toward a small segment of the teaching force — the group of teachers least likely to leave teaching. The National Center for Education Statistics Teacher Follow up Survey reports that while fewer than four percent of teachers with more than 20 years’ experience leave before retirement, 13.5 percent of teachers with under five years’ experience do. The lower turnover among senior teachers might be a result of the higher salaries, or of proximity to pension earnings — we don’t know for sure… But current distribution patterns leave few dollars for pay raises in a teacher’s earlier years where turnover is most acute.

“These practices not only result in lower salaries for most teachers, they also channel funds in ways that jeopardize equity across schools and create havoc for district financial stability.”

DID YOU KNOW?
“Most public-school teachers’ salaries are determined by years in the classroom and degrees held. But a new study from the Manhattan Institute shows that the premium we pay for teacher experience is far greater than is typically acknowledged.”

Pat Korten

In Memory. Oh, Pat, you would have a field day with this newswire! A relentless data gatherer, truth seeker, amazing communicator and reporter, our dear friend and colleague Pat Korten (who we were able to lure out of retirement to help us with writing, editing and policy guidance, after having spent more than 30 years in the communications field), left us unexpectedly and far too soon last week. He would have edited this piece with depth and perfection, attributes he offered to us and to so many others in all his deeds. We will miss him, but know his abundant qualities are now being deployed by God.

Understanding Charter School Growth

Read the original article on The Heritage Foundation website

Once the most promising public school reform available to students, charter schools have stalled. From 1993–2009, the number of charter schools grew from 10 percent–15 percent each year.1 In the 2015 school year, the number of charters increased by just 7 percent. In 2016, school growth dropped dramatically to 2 percent.2 All the while, charter school enrollment has grown steadily each year. However, that masks the real story: Demands for charter opportunities outstrip supply by at least a million students.3

What happened? Charters were called the “grassroots revolt” by Time in 1994, as well as the most bipartisan education effort by Education Week, and were applauded by both Republican and Democratic Presidents and lawmakers.4 Advocates seized on changes in state capitals that were ripe for education reform (not unlike today). They saw an opportunity to provide students who were not well served by their traditional schools with choices of new, independent public schools or public schools made more competitive by charters. Early on, Arizona, California, Colorado, Michigan, and Minnesota set the bar, enacting strong laws providing for a wide variety of new ecosystems of schools and approvals free from traditional education structures. Many other states followed.

All but one of the 13 strongest charter laws were passed between 1991 and 1999 and account for almost 60 percent of all schools open today. Then came the age of political expediency and bad policy decisions. Between 2000 and 2015, only nine states enacted charter laws, accounting for only 233 schools.5 These laws either have stringent caps on the number of charter schools, provide inequitable funding, leave oversight in the hands of school districts, or discourage applications by making the process so onerous.

If declining school growth is a result of poor policymaking, why the steady increase in numbers of students served? There are three reasons.

  • Most states afford successful charter management organizations (CMOs) preferred status, allowing them to replicate or expand without major roadblocks. When CMOs grow, the number of schools may stay constant.
  • It is ironic, given chartering’s intent to create new, diverse schools, that student enrollment exceeds school growth. Today, states favor expanding “proven actors” over new entrants, though the “proven actors” also were once unproven.
  • Demands for test-based accountability drive bureaucratic renewals that often unfairly penalize small and independent schools. CMOs have central offices that are better able to keep up with the regulatory fever that is killing rank-and-file charter schools. These demands create what has been called “management recentralization,” which some wrongly believe is the necessary extension of the “frontier era” of charter schooling with more centralized “planning and coordination.”6

Preference for replication over innovation, combined with increasing oversight, squashes the healthy grassroots start-up activity that once dominated the charter school movement. The once-prominent voices of independent parents or citizens with unique ideas about the kinds of schools they want are now largely ignored.

“This should be the reverse for a movement aimed at decentralizing public education,” as researchers Luis Huerta and Andrew Zuckerman argued in a 2009 journal article.7With limited opportunities for all too many Americans, steady charter enrollment growth is not enough. There must be an ever-growing supply of new schools constantly challenging the status quo.

Jeanne Allen is Founder and CEO of the Center for Education Reform.

Charter School Enrollment


ENDNOTES:

1. Jeanne Allen, “A Movement at Risk: A Manifesto,” Center for Education Reform, 2016, https://staging.edreform.com/wp-content/uploads/2016/06/The-New-Opportunity-Agenda_AMovementAtRisk_AManifesto.pdf (accessed April 30, 2017).

2. National Alliance for Public Charter Schools, “Estimated Charter Public School Enrollment, 2016–17,” http://www.publiccharters.org/wp-content/uploads/2017/01/EER_Report_V5.pdf (accessed April 30, 2017).

3. Based on data from Center for Education Reform, National Alliance for Public Charter Schools, and U.S. Department of Education, Institute of Education Sciences, National Center for Education Statistics.

4. Claudia Wallis, “A Class of Their Own: Bucking Bureaucracy, Brashly Independent Public Schools Have Much to Teach About Saving Education,” Time, October 31, 1994, https://staging.edreform.com/edreform-university/resource/time-magazine-new-hope-for-public-schools-october-31-1994/ (accessed April 30, 2017).

5. Number of schools added during this period, ending with the 2014–2015 school year.

6. Luis A. Huerta and Andrew Zuckerman, “An Institutional Theory Analysis of Charter Schools: Addressing Institutional Challenges to Scale,” Peabody Journal of Education, Vol. 84, No. 3 (2009), pp. 414–431.

7. Ibid.